
A working layer for large 3D scan data
Roam your spatial data every day, and your platform takes shape
One scan file is enough to walk through it in a browser. Add the tools your work turns out to need, and end up with a system that speaks your terms and prints your reports — under your name. Your data never leaves your network.
NUBIDA — ROAM 3D SPACE LIKE A GAME
How Nubida gets used
- 01
Scan it, open it today
Scan the site and you are walking through it in a browser the same day. No scanner of your own required to begin.
Any scanner · 6 formats · 0 installs - 02
Using it surfaces what you need
It roams like a game, so people use it daily. Daily use is what surfaces the friction — and you send it from inside the product.
Feedback, inside the product - 03
What you need becomes a tool
J3D turns what the field asked for into a tool and attaches it — and detaches it when it is not needed.
7 so far · 3 in development - 04
And your platform takes shape
Revising what you need, over and over, is what makes it clear. Only then can you specify the real platform precisely.
Nubida_river-changeNubida_facility-inspectionNubida_your-own-work
1.What is Nubida?
Built to be read three ways
Spatial data is not only worth something once you have extracted a number from it. Simply moving through it is worth something. The name comes from there.
Korean
nubida
“To move through, freely and without hindrance.” Roam 3D space like a game — not only specialists, anyone.
Latin
nubi-
nubes — cloud, mist, the air at dusk. What we handle is literally a cloud of points.
Ancient civilisation
Nubia
The African civilisation famed for its gold. Finding the function your own work needs inside a digital space is a kind of gold prospecting.
All three are right. Roam, and you find.
2.What was the problem?
It is worth a great deal, and nobody can open it
Spatial data rewards analysis in many directions, and simply roaming it is already worth something. And yet—
- 01
The data is large
Tens of gigabytes. It takes a high-spec PC to open at all.
- 02
It takes dedicated software
And that software is built for specialists. It is hard enough to drive that simply walking around the space is already out of reach.
- 03
It grows more complex the more it is used
It grew by absorbing the requirements of many specialist engineers. So reaching the one function you actually need means going through several steps.
- 04
It is fitted to somebody else's work
Outside general domains like construction and civil engineering, the features were shaped by the opinions of particular groups. Not because the product is poor, but because another country's, another organisation's procedures are already set — which is why something is always missing for yours.
So the person who knows the site best never reaches the data.
And if the people with the requirements cannot reach the data, the requirements are never collected at all.
3.What does J3D propose?
Collect the requirements first. The platform comes after.
- 01
The requirements that fit your work have to become features, and those features have to be applied to your spatial data.
- 02
But commission a full platform from the start and the people doing the work lose out to the overall plan. What comes back is software at a distance from the job. And if the direction was wrong, everything spent is sunk.
- 03
So we change the order. Your people use it first, revise the requirements, and revise them again where they were wrong. The features that survive that are the ones you use on your data.
- 04
And then, out of those requirements, you build your platform.
So we built Nubida
The common ground for roaming and recording in a browser. Requirements start collecting here.
“Nubida is the middle step on the way to that platform.”
Not the destination — the place you pass through. Not aiming at a finished product from the start is deliberate, and in exchange the cost of being wrong shrinks to a single feature.
4.What do you need to start?
Whatever scanned it, LAS is enough
Registration and precision survey belong to the manufacturer's software. Nubida starts from its output.
There are two cases
If you have the hardware
Keep using it. Nubida is device-agnostic — all it needs is the LAS that comes out.
If you don't
We start there with you. J3D supplies FJD Trion and has scanned sites itself for years. You can also begin as a service engagement, with no hardware at all.
A scan file
LAS and LAZ go straight in. E57, PTS, XYZ and PTX are pre-processed automatically on upload.
One server
Inside your network. No GPU required — rendering happens on the PC that connects.
A browser
Nothing to install for your staff. They only need the server address.
Internet is optional
It runs without one. Only the map backdrop calls an external API.
The device side of the job ends at LAS. Nubida asks for no vendor-specific format, so you can switch scanners or mix several and everything you have already collected stays usable.
Worried your data is too big to open?
5GB or 25GB — the PC feels the same weight
The PC never loads the whole file into memory. Opening 25GB of data draws roughly two million points on screen — the same load as opening 5GB. File size affects server storage and the one-time conversion, not the workstation.
“If there is budget, spend it on the GPU rather than on RAM.”
Worried your data will leave the building?
Scan data never leaves your network
Put it on one server inside your network and connect with a browser. Raw scans, measurements and field records neither need to go to a cloud nor do they. That is true from day one of the pilot.
Air-gapped operation
It works with no internet connection at all.
No telemetry
Usage data is neither collected nor transmitted.
No server GPU
Rendering happens on the connecting PC, which lowers the cost of the server.
Nothing to install
Staff only open the server address in a browser.
Only the map backdrop uses an external map API. Turn the map off and it runs fully air-gapped.
Hard to just look around in your current software?
Scan today, roam today
One line runs from recording the site to producing the numbers.
- 01Device
Scan
Walk the site with an FJD Trion P2 or S2. A fixed high-precision scanner you own works too — and if you have none, this is the step we start from together.
- 02Device
Produce LAS
The manufacturer's software turns the scan into LAS. The device side of the job ends here.
- 03Nubida
Upload
Upload the LAS and it converts automatically — tens of gigabytes included. Real-world coordinates are read from the LAS or entered by hand, and FJD Trion's .fjdrtk file is picked up automatically.
- 04Nubida
Roam, measure, record
Explore in first person or free view, measure distance, height and area, and tag facilities. Draw a route, replay the viewpoint and export it as video.
- 05Nubida
Spatial analysis
2D sections, volume, contours and time-series change. It does not end at looking — it produces numbers.
Nubida takes LAS. LAZ, E57, PTS, XYZ and PTX convert automatically on upload as well.
5.What does Nubida do today?
In a browser. No install, no training.
This is not a boast about features. Requirements only get spoken once somebody can open the thing, so this is the part we removed first.
Roaming
Walk in at eye height, in first person, in a browser. Five minutes to learn.
Point records
Attach photos, video, audio and documents to that spot. Records scattered elsewhere finally get coordinates.
Measurement
Distance and height.
Routes
Draw a path and get the travel distance and the time it takes.
Route video
A walkthrough video comes out of that same path.
Map
Check where it is on a map using the GNSS coordinates captured with the scan.
Gaussian 3D
A photographic view makes the explanation richer. Measurement still happens on the point cloud.
In one line,
heavy 3D, handled like a game.
A closer look
Roaming is the point
You don't look at it. You walk into it.
This is not a viewer you spin with a mouse. Set eye height, walk in first person, and you see what you would see standing there. That is why staff stop making the trip back to site.
- WSAD and the mouse — five minutes to learn
- Adjustable eye height reproduces the real line of sight
- Lighter while moving, full quality the moment you stop
Annotation and tagging
Field knowledge accumulates on the 3D itself
Attach information to the exact point in space. Records scattered across drawings, photos and spreadsheets finally get coordinates.
- Drop a marker anywhere, then tag name and category
- Structure / equipment / object / damage / marking / hazard
- Attach photos, video, audio and documents to each marker
- Mark it on the spot while walking in first person
Used for
Routes and viewpoint replay
A walkthrough video, from clicks alone
Click the waypoints and a site tour comes out. No editing software, no specialist.
- 01Click waypoints — In order, in 3D
- 02Route is generated — Travel time per leg
- 03Camera drives itself — Viewpoint replayed along the route
Presentation views (front, side, plan, bird's-eye) and first person are both supported, exported as WebM.
When you have to show it, and the source cannot leave
Research institutes have to show their method and their results to the press and to investors. The actual result data cannot leave for security reasons, so a separate explanatory set had to be produced. In Nubida, drawing a route produces the video.
The source stays inside. Only what you meant to show goes out.
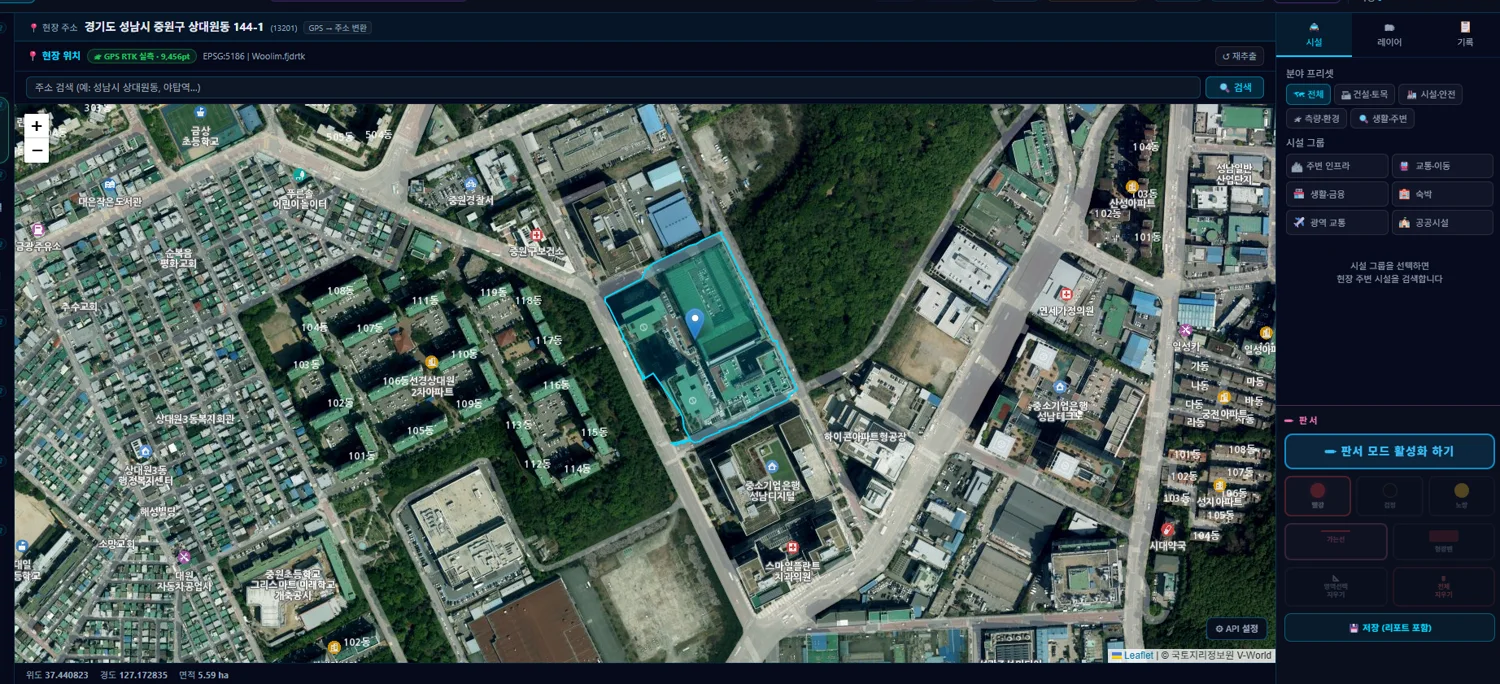
RTK coordinates
A cloud of points with no origin, placed on the map
A scan on its own is a relative-coordinate blob with no origin. Feed it RTK survey values to assign absolute coordinates, and from then on it overlays a map and can be found by address.
- Map overlay — see where the scanned space actually is
- Reverse-geocode coordinates into an address
- RTK quality diagnosis (FIXED / FLOAT)
- Tilted scan floors levelled by XY alignment
In one product
Point cloud and Gaussian
Measuring and showing are different jobs. Nubida keeps both in one product, each in its own dedicated viewer.
Point cloud
The measuring side. Distance, height, volume and sections on real coordinates.
Gaussian 3D
The showing side. It looks photographic but it is an approximation, so it is not used for precise measurement.
Does getting a request through feel slow — and come out changed?
Just capture it and send it. The feature changes
Leave requirement collection to the sales process and the loop breaks. So we put it inside the product.
Feedback
Send what got in your way from inside the product. It arrives with the development team as written — it does not go through sales.
That much is common ground. Past this point, every site wants something different.
6.What did the field ask for?
Features are not the goal. They are the output.
None of the tools below came out of a planning room. Every one of them came from a site. New tools are built to attach and detach independently, and we unlock only the ones you need.
which site asked for it
we need length and area off a section
2D section
standardCut anywhere for a vertical or horizontal section. Slide the position and watch it update.
which site asked for it
we need the quantity in the pile, and how many trucks that is
Volume
Select an area and the volume above the datum plane is integrated — earthwork quantities and haulage conversion included.
which site asked for it
we need river deposition and scour as contours
Contours
Divide height from a datum plane to read the terrain at a glance. Division count and interval are adjustable.
which site asked for it
how much has the riverbed moved between surveys
Time-series (river deposition and scour)
Compare dredging before and after, track deposition, and read riverbed change across flood events.
which site asked for it
thermal capture works, but there is nothing to do with it
Thermal time-series
in developmentWalk under the roof a drone cannot reach and capture temperature across the whole space. Overlay layers per survey, compare deviation by colour, and track the trend at a given point.
which site asked for it
warehouse stocktaking — stacking differs at every company
Inventory
in developmentRegister the stacking unit, tag the stacks, and the count is calculated and reconciled with the ledger.
which site asked for it
how much has the slope moved
Time-series (terrain)
in developmentCompare change against the slope plane between surveys to flag collapse and scour risk.
Only what you need ships
Each tool is built to attach and detach on its own. That keeps the cost of trying one low, and leaves nothing behind when it is not needed.
You can explain why the number differs
Volume figures usually diverge between vendors because the datum plane differs. Nubida lets the user inspect and set that datum, so the basis of the number can be explained.
How it runs
- 1
Collect the need
Starting with what has to be measured and what has to be kept
- 2
Scope and quote
We agree the scope and the schedule first
- 3
Build and deploy
On top of Nubida, onto your internal server
7.Where does Nubida go next?
Nubida_your own work
Once the requirements pile up, it branches into a build for that organisation. Different organisations need different things, and they are supposed to grow apart. Force them into one and you are back to software written at a desk. And by then it is clear what you need — those requirements are the specification for your platform.
- 01
Base deployment
One server inside. Your staff connect with a browser.
the smallest unit that collects requirements
- 02
Requirements built in
What was collected becomes features — a J3D development contract.
the centre of the business
- 03
The derivative settles
It stays as that organisation's platform.
what requirements turn into once they accumulate
The words on screen become your words
It is not just the logo and the product name. The terms on screen and the report titles are rebuilt in the language of your industry. Nobody has to learn new vocabulary.
For example
- SiteFacility site
- Site analysis reportRail facility inspection report
- TagInspection record
- Expected routeInspection route
We are the ones who learn your vocabulary.
Now put your own name in the blank
Start a pilot on our sitePlainly
What Nubida cannot do
We say this first. It is how the tool ends up being exactly right for the people who know it.
Registration and precision survey
The manufacturer's specialist tools are the standard. Keep using them. Nubida is the working layer on top.
Measuring from Gaussian
You can roam a converted Gaussian file too. It just looks photographic while being an approximation, so measurement is done on the point cloud.
Time-series everywhere
What is complete today is rivers. Slopes are in development.
Precision reverse engineering
Work that needs the full-detail original belongs in a dedicated tool.
Panorama image quality
For station-captured photographic panoramas, the manufacturer's bundled viewer is better.
And one more — right now we run pilots rather than sell
Pricing and public-procurement registration are in preparation. Which means those who start now arrive while requirements still shape the product. That is how it has always been built here — river time-series, stockpile volume and warehouse inventory all came from the field.
Where it is being used
a starting point
These are the places that actually asked. Yours does not have to be on the list.
Site recording
Keep a site that is about to disappear, and share it with people who never went
Fire service training
Real buildings, used as training and analysis material
Marine and vessels
Down to the lower holds people struggle to enter
Research programmes
Visuals for non-specialists, and calculations that replace expensive analysis software
Construction
Progress and status on one set of coordinates
Facilities and stock
Pile stocktaking and maintenance records, placed on coordinates
If the work involves recording a space and looking at it again later, it fits. A pilot starts with hearing that story.
Why J3D
There are three ways to get a tool that fits your site
Ask the manufacturer
An excellent global standard product. It just won't change for one site of yours.
Ask a systems integrator
Capable. The cost and the time start with understanding what you measure and what you keep — learning spatial data from scratch along the way.
J3D
We were already on those sites. We have scanned power plants, electrical facilities and heritage buildings ourselves, and Nubida grew by solving those requirements one at a time.
So we understand your story without a translator.
What you need
The PC that connects
| Item | Minimum | Recommended |
|---|---|---|
| OS | Windows 10 (64-bit) | Windows 10 / 11 (64-bit) |
| CPU | x86-64, 4 cores | 6 cores or more |
| RAM | 8GB | 16GB |
| GPU | Integrated graphics (WebGL) | Discrete GPU, 4GB VRAM or more |
| Browser | Latest Chrome / Edge | Latest Chrome / Edge |
Server
- 32GB RAM recommended
- Storage of at least 2.5× the source size
- No GPU — rendering runs on the connecting PC
- No internet connection required
Files you can bring
Direct conversion
Auto pre-processing, then conversion
Gaussian 3D
E57, PTS, XYZ and PTX are pre-processed automatically on upload before conversion.
What does your site look like?
A pilot starts with one set of data. We work out together what has to be measured and what has to be kept.
- 1
Get the idea
This page: “ah, that's the approach”
- 2
15-minute demo
Roaming it once yourself is usually enough
- 3
With your site
We open a pilot on one scan set — or settle that first if you have none
Care to roam it once?
One email is enough. You do not need to send us your scan files.
Write a pilot enquiryPricing and procurement registration are in preparation. Requirements from those who start now go into the product.